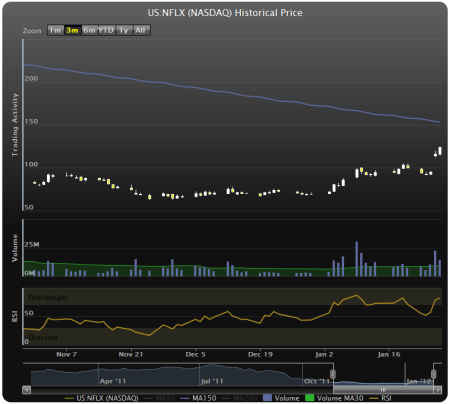
If you watched recent Netflix (NFLX) move, I think you are one of those who are screaming “Yes!” because they own the stock, or those who sigh “Wow! I wish I have bought it earlier.”
Sometime ago, after I read Stan Weinstein’s book, I promised myself to never buy a stock which price is below its MA150. And I’m glad I did, because it saved me from many mistakes (I’ve made plenty of others though). I used to set a buy transaction right above MA150 and every time when I saw stock price drop lower without braking MA150 level and without triggering my buy, this rule got stronger and stronger in my head.
That is why I did not buy NFLX even everybody around me were screaming about this company’s return. Well, here is a daily chart and the price is clear way below MA150 even when it moved up 20% in just one day.
However, if you take a look to a weekly chart (shown below) you can see that weekly price crossed MA30 line 4 weeks ago.
Just to make it clear, for weekly chart MA30 means 30 week MA therefore it is the same indicator as 150 days moving average on a daily chart (30 weeks * 5 days per week = 150 days).
So, I think on a weekly chart it was a “buy” even when daily price is still way below MA150.
Conclusion:
1. I should use both weekly and daily charts and even when price is below MA150 on a daily chart, but crossing MA30 on a weekly chart, well, maybe this is an early signal to buy.
2. If I got an early signal to buy, but if it is violating one of my own rules – perhaps a short-term call option will solve the problem. It minimizes the amount of money at risk and potentially can bring quite a good gain.
P.S.
If you really like options you may find the following video interesting. The author is talking about option strategies for NFLX:
S-Trade Option Startegy

