We just started a paper trading account in Investopedia.com (user name is stock2own). By saying “we” I mean a small group of stock2own enthusiasts. The whole purpose of this is to exercise our trading philosophy, test investment ideas and gain some confidence of what we can do and what we cannot. So, ideally, we would like to have it transparent and available for everyone to view, criticize, question and follow if you wish. However, so far I cannot see how to make our trades available for you (if you know how, please, comment in this blog!). So I will post a short description of every trade here, in this blog. We will try to add a reasonably well detailed explanation of how we found a stock, why we think this is a buy or sell and so on.
Before I describe our first trade a few notes about Investopedia and rules we will try to follow:
- Option transactions are limited to simple buy/sell and Scott was really upset about that. We will see what he can do with the limited set of tools.
- By default each new account has $100,000 paper money to invest. So, we will try to keep approximately 5-6 securities in our portfolio at any given time. In other words, each transaction should have total cost of no more than $20,000.
- We are going to use fundamental analysis to select stocks and technical analysis to get in and out. Both types of analysis we are going to do mostly using stock2own.com web site.
I think this is it and here is our first trade.
On December 11th I booked our first paper trade in Investopedia:
Buy CELG (Celgene Corporation) 300 shares @ $64.05 (limited price)
Explanation:
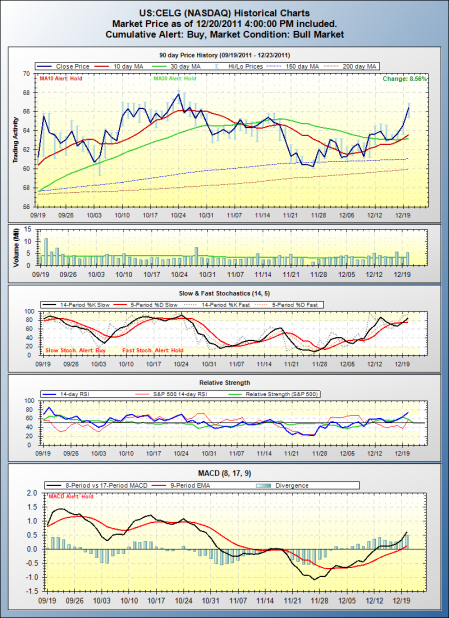
It seems that CELG just crossed up its MA 150 at the beginning of December. It has an average volume, which is not very promising for a long trade, but all other indicators suggest that there is a potential to move up:
- Stock just crossed up MA 30, both long-term Moving Averages (150 and 200 days) are pointed up.
- MACD and Stochastic show positive signs.
- RSI is just crossed level of 50 and pointed up.
I set first order to be executed if the price will go higher than $64.05. Personally, I do not place orders when market is closed, because all those orders will be executed first deal in the next morning and there is always some crazy activity for the first 20-30 minutes of trading day and you never know what is going to be next… But first trade I booked on Sunday night when market was closed. Latest close price is $63.58, based on the current chart it seems that next resistance level is around $66? So, I just added some threshold for the stock, just in case if the price will go down tomorrow morning, so the trade will not be executed and we will have time to review and adjust our strategy.
The next first half of day CELG price was moving down and Scott adjusted the purchase price of our order to $63.70. In a middle of the day price started to move up and out order was filled in with the purchase price of $63.73.
At that point we had to book a stop-loss order with activation price in a range of $60.70 – $60.50. The chart shows support in the range of $60.70. We want to give price a bit of room to move up and down, but do not want to give up more than 5-7%, so price of $60.50 seems right.
All these days since purchase, the volume of the stock is average, which means that “volume does not confirm price move up”. However last few days CELG price is moving up and when it went over most resent resistance line at $64.80, we moved stop-loss a bit up to the level of $63.30 (right under 30 days MA and a bit below most resent resistance line, just to give stock price a bit more room).
As of today we have in our portfolio:
We are looking for other prospects to buy and will keep you posted.
Any suggestions? Comments?

